Summary:
rendseq is an analysis package designed to extract data from end-enriched RNA sequencing (Rend-seq) data.
I have also built a companion website - rendseq.org - that is meant to empower people to understand/use Rendseq protocol and to be able to interact and explore rendseq data in real time!
What is Rend-seq?
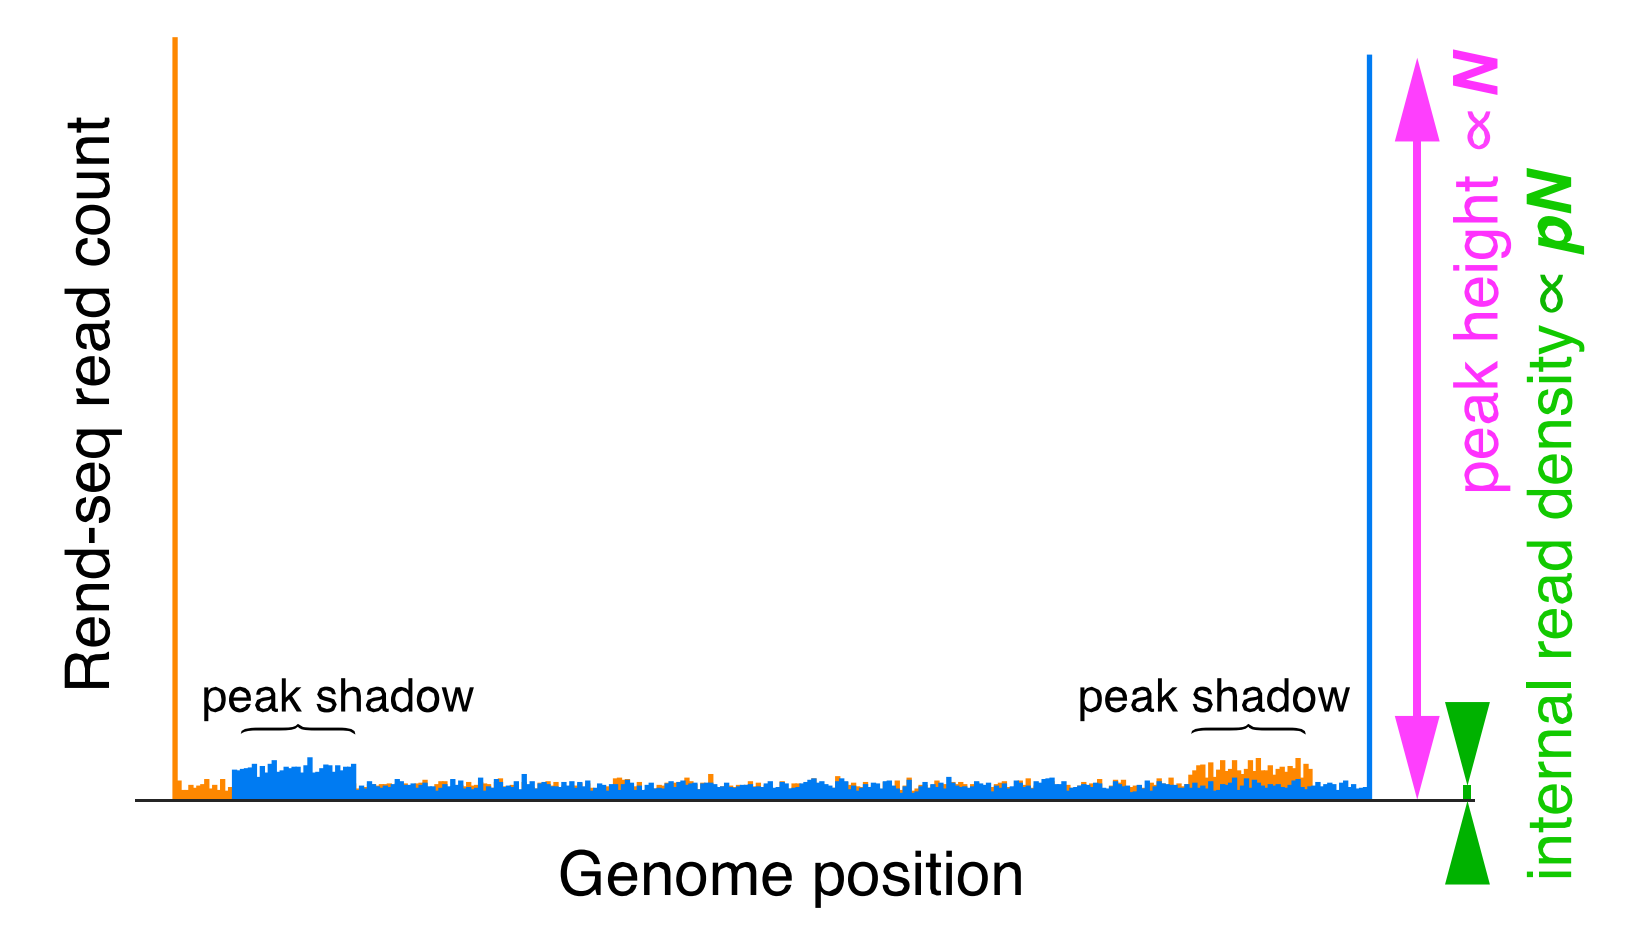
Rend-seq is an RNA sequencing protocol that enriches for the ends of transcripts. What is Rend-seq data? Well it looks like this:

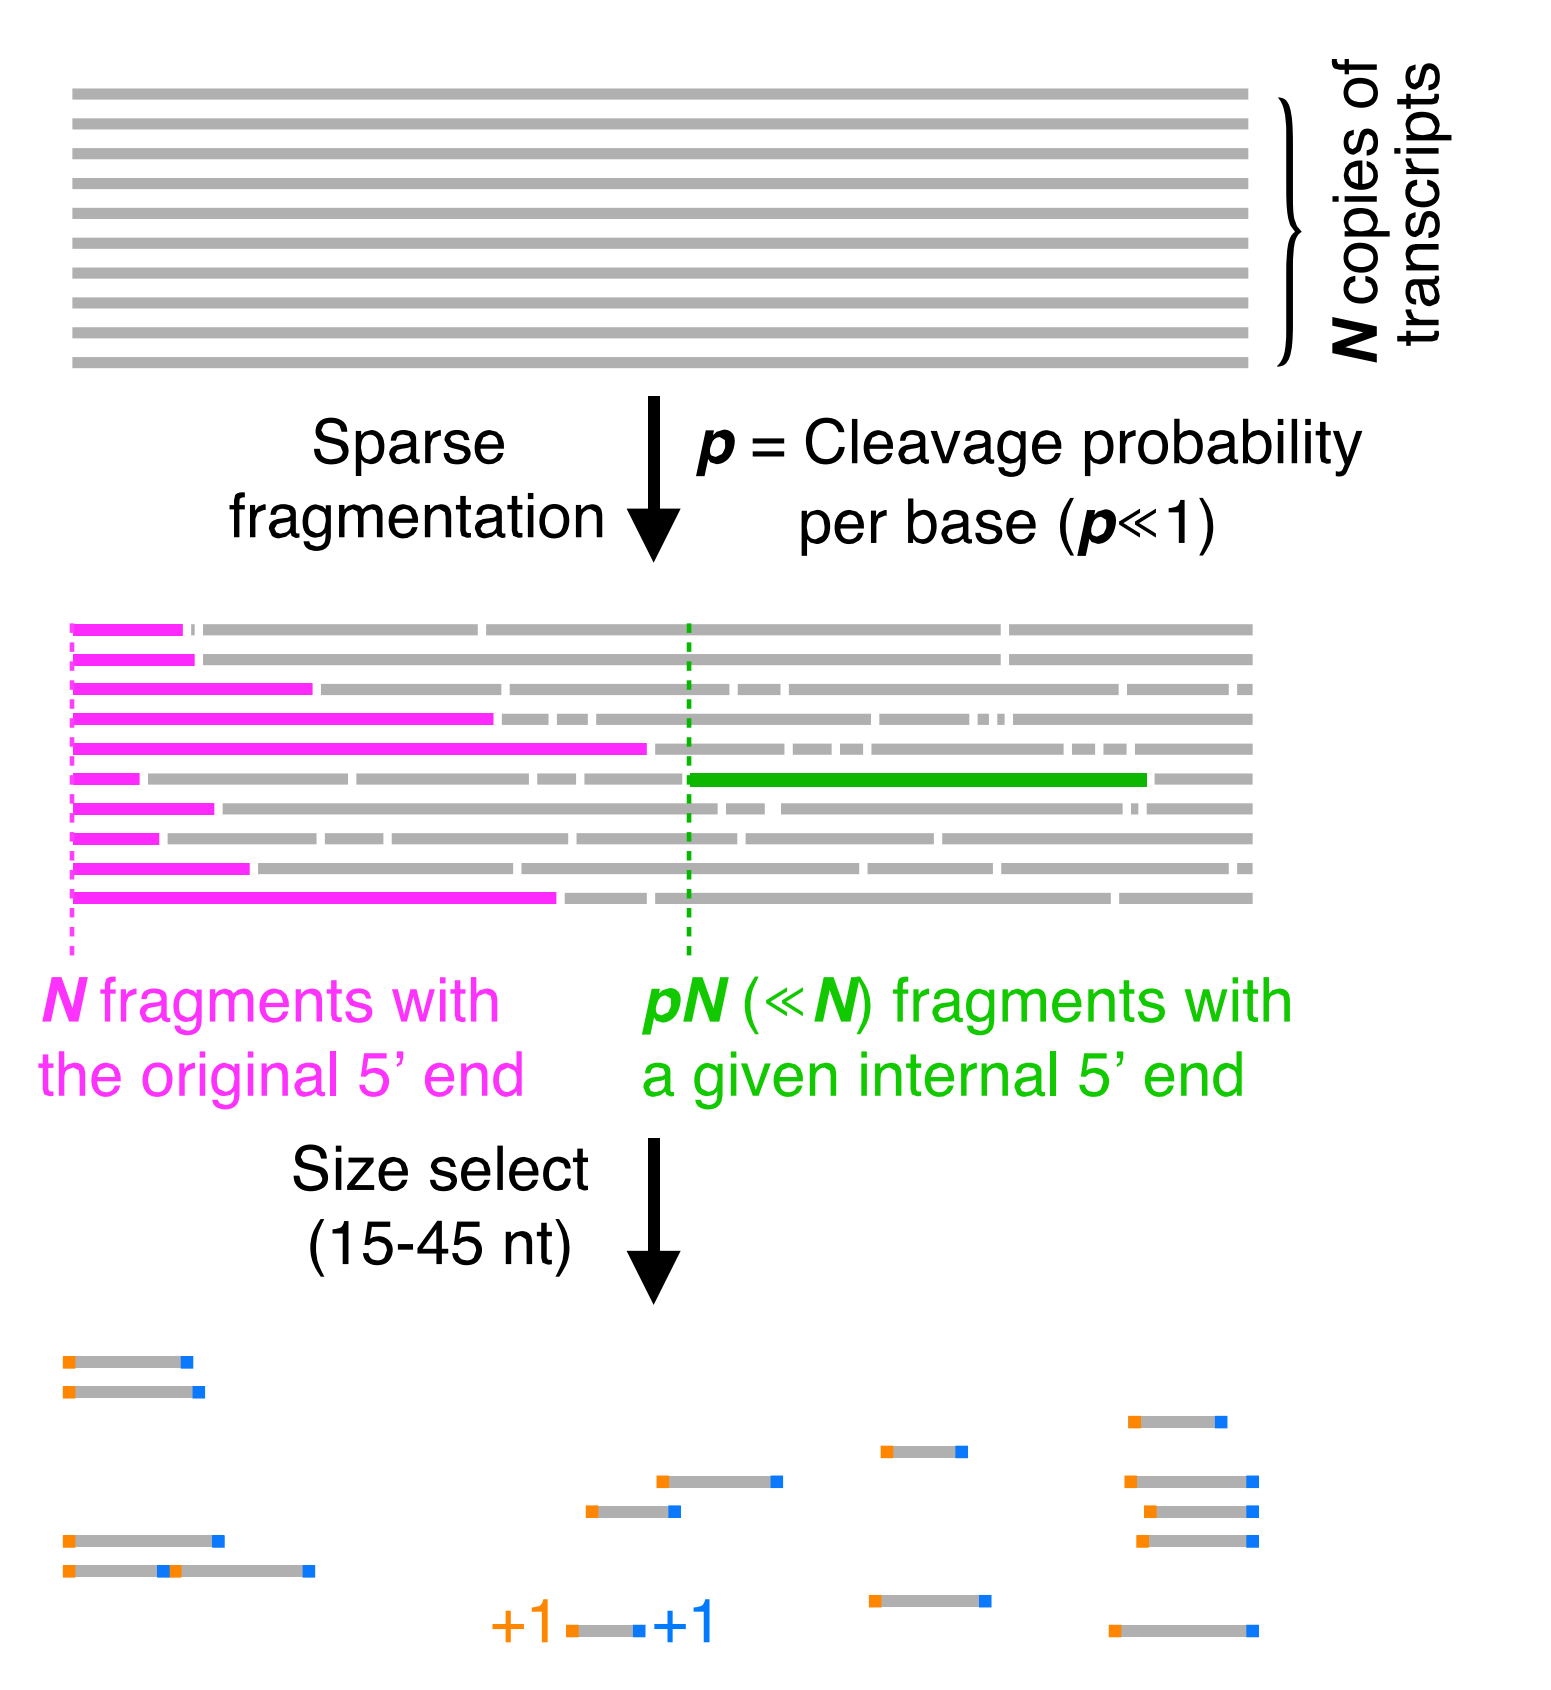
As you can see we have a tall peak in orange - which corresponds to the 5’ end (or start) of an RNA transcript and much later a blue peak which corresponds to the 3’ end of the transcript. These features are more apparent in Rend-seq data than they are in typical RNA-seq data because we enrich for the ends of transcripts during our library preparation:

By sparsely fragmenting the RNA, then size selecting it we are able to increase the likelyhood that we sequence fragments which have the original end of the transcript. Then after sequencing we can look at the 3’ and 5’ ends of every mapped read and add a count in each position. By doing this - we achieve the Rend-seq signature seen before.
To learn more about rendseq - including an illustraated protocol - head over to rendseq.org
What Analysis Goals Might you Have?
- Identifying peaks
- Calling Transcription Units
- Removing artifacts - for example the shadows in the example Rend-seq data above.
Acknowledgements:
This analysis project would not be possible without .. Rend-seq data! For which credit goes to the people in my lab who developed this technique, made the original analysis scripts and were generous with their time to help me understand what was actually going on/what data analysis questions needed to be solved. Particular thanks go to Jean-Benôıt Lalanne, James C Taggart, Lydia Herzel and my PhD advisor Gene-Wei Li. Check out their original 2018 Cell paper to learn more about this method and see some of the applications it was used for!
Awknowledgements are also due to the rest of the Li lab who provided lots of feedback on this analysis pipeline and helped shape it into a more useful tool. Particular thanks go to Jenny Cascino and James Xue who were both early users/testers of this package and provided invaluable suggestions as to how to make it better.
Thanks are also due to the people who joined me on this open source software adventure and contributed their own code to the repository. Thank you Julian Stanley and Connie New!